
Growth Funnel Performance Report
Growth Report: full-funnel performance marketing
the AAARRR pirate funnel unraveled
A survey of 3,167 growth hackers who represent $1.4 billion in revenue annually give a unique peek into how a growth funnel really performs and the challenges they face.
The study takes a deeper look into growth funnel effectiveness, design, setup, capabilities, optimization and into the famous growth hacking AAARRR pirate funnel framework and how they perform.
This study will reveal groundbreaking insights never previously undertaken in the growth hacking industry. Let’s take a deep dive into the data
Summary of key findings
Growth Funnel Performance Report
Funnels Effectiveness
Funnels Design
- 52% of growth funnels have 5 steps, which is an average size.
- 51% of funnels take 7 days plus for customers to flow from start to end.
- 69% of the costs in building a funnel are $500 and more.
Funnels Setup
Funnels Capabilities
- 41% of funnels are in their 5th generation and beyond.
- 61% of funnels have 1 year plus experience in development.
- 52% of teams working on funnels are between 6-10 people.
Funnels Optimization
Funnels – AAARRR growth hacking
- 30% of optimization is focused on revenue phase of the funnel
- 71% of optimization required in awareness is 50% and less of efforts
- 39% of efforts in the acquisition of a growth funnel yield a 51- 100% return.
- 41% of optimization is 10% and fewer efforts for activations
- 43% of optimization efforts have a 100%+ impact on growth
- 62% of referral optimization is at a 51- 100% level of efforts made
- 35% of optimization efforts are focused to yield of 51- 100% for revenue
Conclusion – growth funnels need a lot of work to be optimized
What is a Growth Funnel?
A growth funnel has a few alternative terms and concepts that overlap in some form or another, such as :
- Marketing funnel
- Marketing pipeline
- Sales funnel
- Sales funnel
- Sales pipeline
- Sales process
These are some of the more common high-level references you will come across. Some of the more niche reference points would be:
- Growth Hacking Funnel
- Growth Funnel
- Growth Marketing Funnel
- Performance Marketing Funnel
- Full funnel performance marketing
- Full funnel marketing
- Full funnel
- Pirate Funnel
- AARRR Funnel
- AARRR Funnel
- Pirate AARRR Funnel
- Pirate AARRR Funnel
In essence, a growth funnel has three parts. First is the top of the funnel, the second is the mid-funnel and the third is the bottom of the funnel.
- Top of the funnel – creating awareness and interest
- Middle of the funnel – driving interest and desire
- Bottom of the funnel – conversion or action taken
The goal behind a funnel is to attract the right potential customers, qualify their interest in your offering, and convince them to purchase your product or service. This journey takes some effort in understanding your target customer well, solving a problem they have, meanwhile creating value for them and finally making it something they would like to continue using and tell others about.
Why a growth funnel performance report is important
This study helps growth hackers, growth teams, and executive leaders have a first-hand, and front-row seat into the actual performance and challenges facing growth funnels. This helps decision-makers:
- Focus on low-optimization areas for growth hacking
- Benchmark performance growth hacking
- Identify new optimization techniques
- See where to focus optimization efforts
This helps get growth teams focused on what matters most when building or optimizing an existing growth funnel. Growth teams use these performance measures to optimize and enhance their growth hacking processes internally.
Who is the growth funnel performance report for?
This study is for growth hacking buyers and service providers. This includes freelancers or experts, agencies, or organizations’ in-house growth units.
This study primarily targets first-level decision-makers who are principal business owners or those who directly work for the principal business owners and those responsible for growth functions. This includes
- chief executive officer,
- chief growth officer,
- co-founder
- coo
- director,
- founder
- growth hacker,
- growth manager,
- growth marketer,
- growth marketing
- managing director,
- owner
- partner
- president.
Although titles and roles may vary per organization, the goal is for primary decision-makers as participants and those who consume and use this study.
How to use the growth funnel performance report
This report is to be used as a strategic decision-making source. This helps decision-makers with the following inputs
- The state of growth hacking services,
- Key economic and financial performance metrics,
- Service source and types being consumed,
- Return on investments and success rates as a benchmark, and
- Spending patterns and allocation of services used.
This will help decision-makers decide how to reposition, make better use of service providers, or for service providers to enhance their offerings to become more competitive. Ultimately these inputs become part of the growth hacking process.
Subscribe for updates
Growth Funnel Performance Report
Lets get started
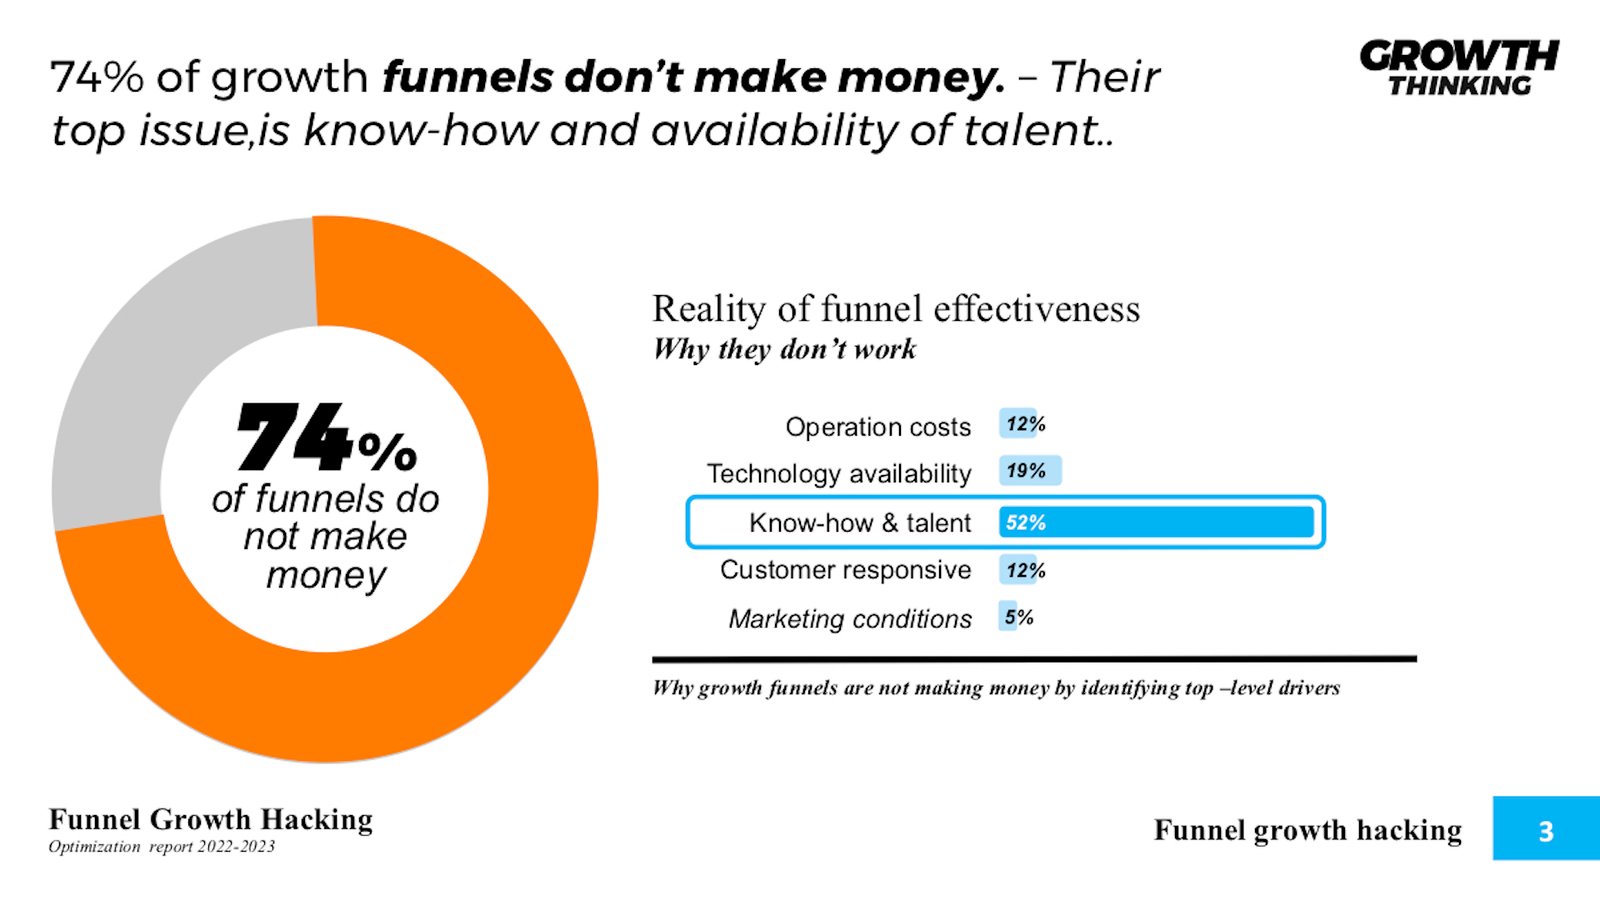
74% of growth funnels don’t make money. — Their top issue is know-how and availability of talent..
74% of growth funnels don’t make money. – Their top issue is know-how and availability of talent
Is Your Funnell Working
74% of funnels do not make money and are mostly attributed to know-how and talent.
95% of buyers purchase from sellers who provide content that addresses their concern according to DEMAND GEN REPORT
Background
Funnels are core to the growth hacking process of any business whether digital or not. A growth funnel, in short, is a process where revenue is identified all the way to conversion. A funnel helps reinforce internal and external resources and processes toward revenue. The better optimized a growth funnel is, the better your revenue will be. Funnel technologies have evolved and made this process much more affordable and effective.
Context
Most funnels are not well-optimized due to the lack of usage of data. One of the key areas is behavioral data that enable better segmentation, and the creation of new strategies to optimize a funnel. Having good data means good outcomes, but only 5% of decision-makers know what to do with the data they have. Hence, talent and know-how in this field are crucial to using data, for data-driven decisions. Such capabilities that are central are models like the T-shaped growth hacker
Takeaway
Finding, retaining, and developing the right talent and building internal capacity are key to funnel optimization. Having good data is key, and being able to see between the cracks is vital. Those cracks are handover points between phases within your funnel; 92% of funnel designs and operations overlook the importance of this over time.
Size does matter - shorter funnels outperform longer ones, which wasn’t the case in the past
Funnel Steps
52% of growth funnels have 5 steps, which is an average size, but, with time, data show that the shorter the funnel the more effective it becomes

68% of companies have not identified or attempted to measure a sales funnel, and 79% of marketing leads are never converted into sales – Salesforce
Background
Funnels come in many sizes as measured by steps, but also to not forget the duration, complexity, and costs involved. By nature, a funnel gets more complicated with time, which is all the more reason for shortening funnels. The learning processes extracted from the data points collected are key to optimizing next-generation funnels. One of the popular frameworks is the AARRR pirate funnel approach. This plays a vital role in the growth hacking process overall.
Context
Shorter funnels are proving to be more effective with time. The modern sales funnel stems from the 1950s approach to sales by using the sales letter as the funnel. By nature, these letters got longer over time due to the limitations of print as a medium. With time, the process was adopted in length into digital means as well. This initially worked in the 90s as social media did not exist in mass adoption yet. With the introduction and mass adoption of social media in the 2010s, shorter funnels emerged.
Takeaway
Old-school over-information-driven funnels don’t work well anymore. Customers are overwhelmed with over-information. Hence, shorter funnels are now more adaptive to consumers, especially younger consumers with higher spending patterns due to the volume of purchases online.
Over half of growth funnels exhaust resources and increase customer drop-off by 78%
Funnel Duration
51% of funnels take 7 days or longer for customers to flow from start to end.

Harvard Business Review found firms who attempted to contact a lead within an hour of receiving a query were almost 7 times more likely to close the sale.
Background
Nurturing potential clients is vital to cultivating positive outcomes. Having to walk customers through a journey of information and persuasion isn’t easy. Knowing where to take what actions is vital, especially when it comes to rejections or conveners of potential customers.
Context
The most effective funnels are able to convert a customer fast. For that to work, the customer must require the offering immediately. That is possible with highly targeted ads, which are becoming too costly for most funnels to run a profit. Hence organic-driven traffic is key to making a funnel more economically viable. The cost of nurturing is also another cost drive. The nurturing process isn’t for customers who would not purchase at the end but quite often those are the ones who end up populating most of a funnel.
Takeaway
The shorter the funnel, and the quicker you can address a customer’s immediate needs, the more effective your growth funnel will be. When using the AAARRR pirate funnel framework ensure each phase is as short-as-possible although the model itself is longer in nature
Subscribe for updates
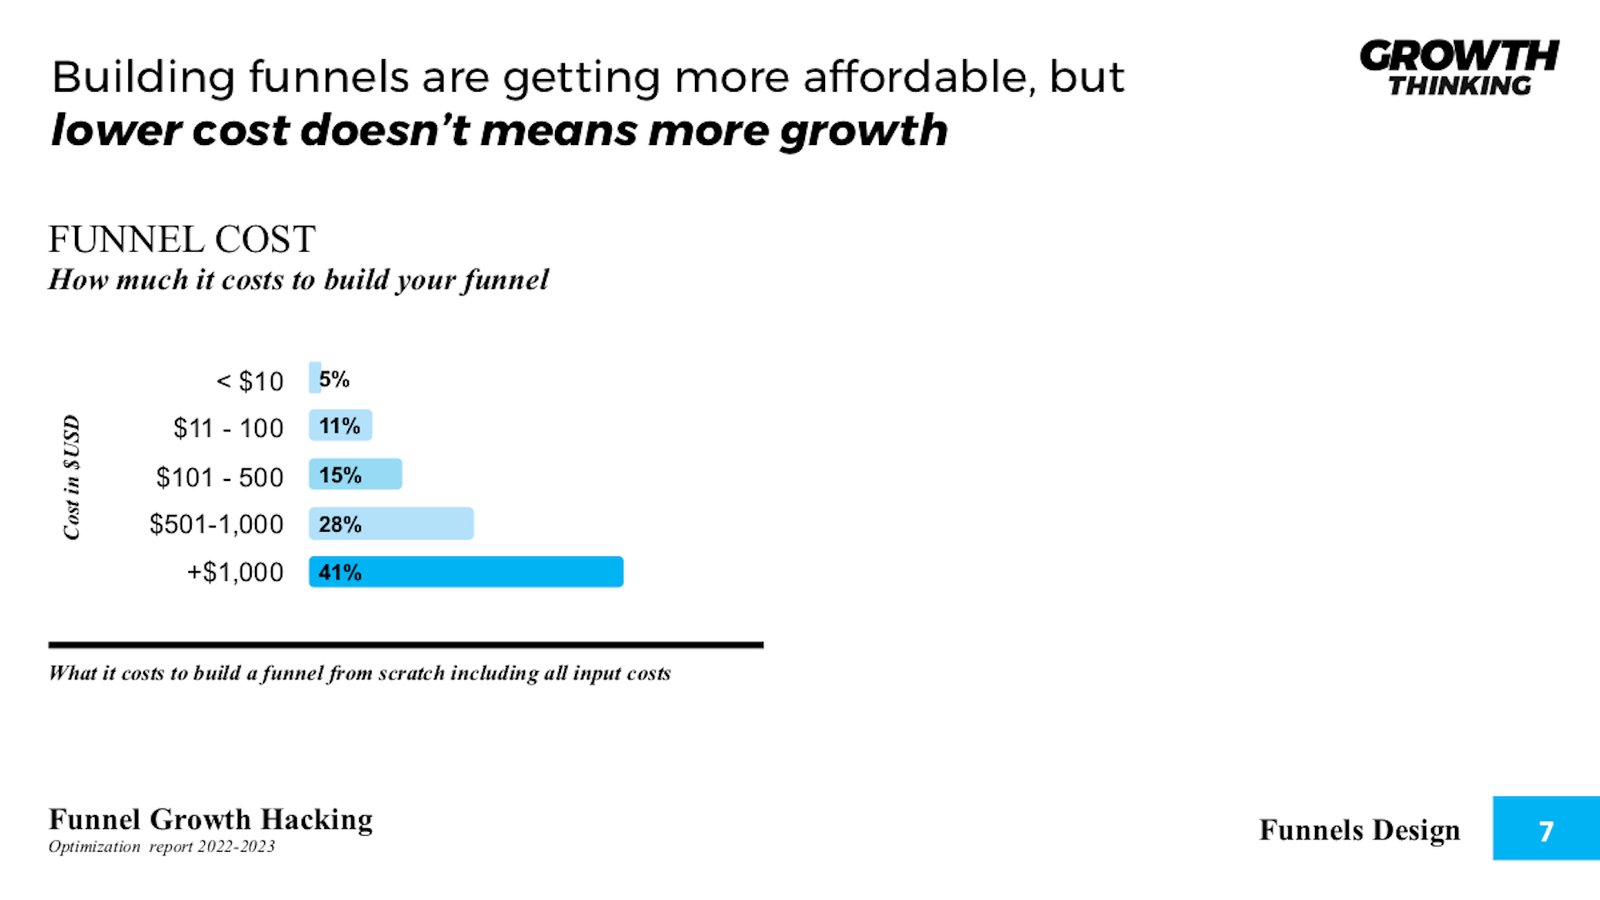
Building funnels is getting more affordable, but lower cost doesn’t mean more growth
Funnel Cost
69% of costs in building a funnel are $500 and more. Costs in general are dropping, and many more affordable options are emerging.
Costs dramatically drop when retaining current customers, which results in 6–7 times less costly compared to acquiring new customers. – Propeller CRM
Background
The digitalization of funnels is decreasing as more options and better technology emerge. A large part of this process is automation and integration. The more options for automation and integration, the more effective a growth funnel can become.
Context
The cost of building a funnel. There are two overall options, building your own or using a funnel-building tool. For smaller organizations and those starting, using existing tools is best. For those who outgrow the off-the-shelf tools, they will naturally start building their own over time. The most popular off-the-shelf tools are as studied by ToolTester Network:
- GetResponse – All-in-one
- Systeme.io – Free plan with all the features
- Kartra – Great for agencies
- ActiveCampaign – Excellent automation capabilities
- ClickFunnels – Unlimited contacts
- HubSpot – Contact management features
- Wishpond – Good-looking templates
- Thrive Suite – Good value for money
- Keap – Plenty of options
- Leadpages – Collect unlimited leads
- Landingi – Great looking landing pages
- Instapage – Sophisticated A/B testing
You can learn more about funnels and growth systems here. Using these tools is an essential part of the growth hacking process, and they are often used as integrations for other purposes.
Takeaway
Start small, start simple. There is everything from free to low-cost funnel tools ready to go. Using existing templates and modifying them is a common practice and saves a lot of time and money. With time, as you scale and grow, you will need more automation and integration power, and hence this eventually leads to customer-built funnels. The best part is when you have a working funnel you grow over time; you can use those learnings in your custom design work.
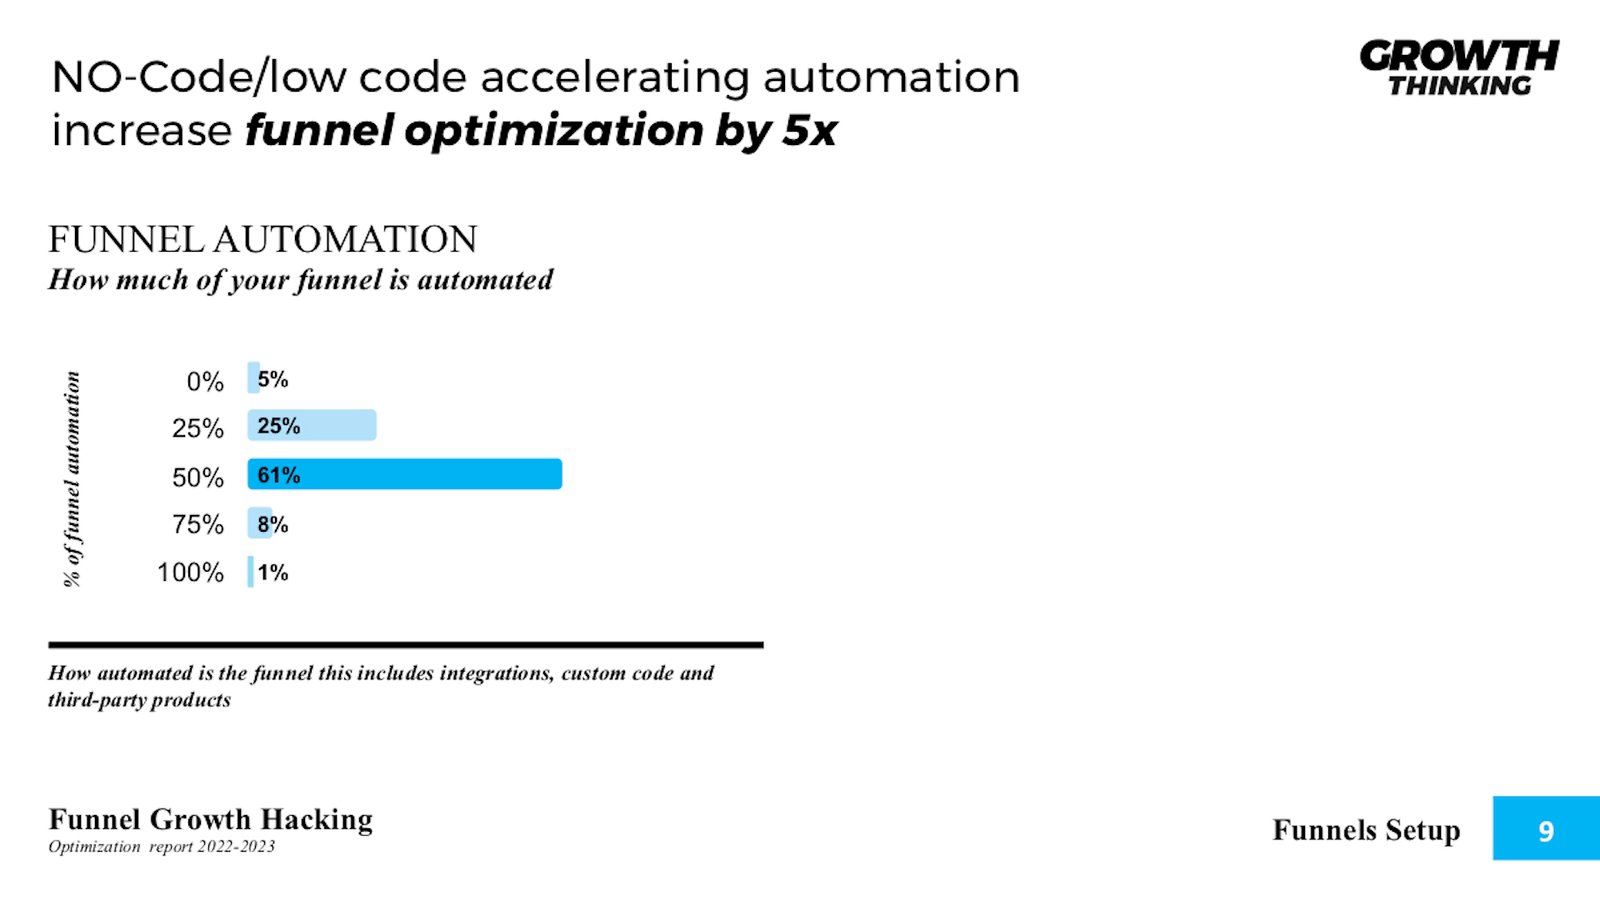
No-Code/low code accelerating automation increases funnel optimization by 5x
Funnel Automation
91% of funnels are 50% less automated.
By the end of 2021, 75% of application development will use low-code platforms, according to Forrester
Background
Automation is a precursor to scaling a funnel. The challenge with automation is that native and pre-integrated features are the easiest to automate. Once you go beyond that, automation becomes challenging. With the advent of no-code and low-code tools, this has become easier to make happen. No-code and low-code tools have become an essential part of the growth hacking tools book.
Forrester has labeled this digital process automation (DPA), and IDC has used the label intelligent process automation (IPA) for the same thing. In both cases, they refer to the integrated deployment of technologies such as robotic process automation (RPA), intelligent business process management (IBPM), machine learning, and artificial intelligence (AI) to streamline and orchestrate as many tasks, activities, and processes as possible.
Context
Automation tools, techniques, and platforms are on the rise. They are estimated to reduce costs by up to 90% and speed up production by 25x. A proposition appealing to all sizes of businesses. In reality, the investment in such companies is driving more commercially available tools that can be instantly deployed and utilized.
Funnel evolution – There are 4 phases a funnel itself will go through. These phases are mostly driven by the commercial growth of the funnel itself. As more users and customers populate funnels, the more complex they get over time. With more complexity comes more customization and this is where no-code and low-code come into play, Here are the 4 phases.
- Basic funnels – a single or few offerings are in the funnel with a relatively simple and short funnel structure
- Intermediate funnels – few to several offerings are in the funnel with more complex entry points into the funnel and deeper segmentation
- Advanced funnels – several to many offerings are in the funnel with a much more complex structure and much deeper fanatics for behavioral segmentation and targeting.
- Custom funnels – Building on advanced funnels, off-the-shelf solutions no longer meet requirements, and custom funnels are needed to meet unique business requirements
No-code and low-code solutions have implications for all 4 phases in the funnel evolution. From basic integrations, using tools like Zapier or Integromat to meet customer design. No-code solutions will present significantly deeper opportunities for funnels to address specific behavior and segmentation with well-targeted opportunities.
Here is a list of no-code and low-code platforms provided by Software Testing Help
- Visual LANSA
- Retool
- Quixy
- Creatio
- GeneXus
- Zoho Creator
- Web.com
- Appian
- KiSSFLOW
- Mendix
- OutSystems
- Salesforce Lightning
- Microsoft PowerApps
- AppSheet
- Google App Maker
- FileMaker
Takeaway
No-code and low-code are the solutions to the automation of a funnel. This applies to basic, all the way to custom funnels. As you scale and grow, your funnel will naturally need more customization and the economics behind building your own tool from scratch doesn’t add up. At least the economics do not make sense in the early phases. Once monetization has been proved and continues to sustain, then custom funnels and no-code and low-code tools are much more justifiable.
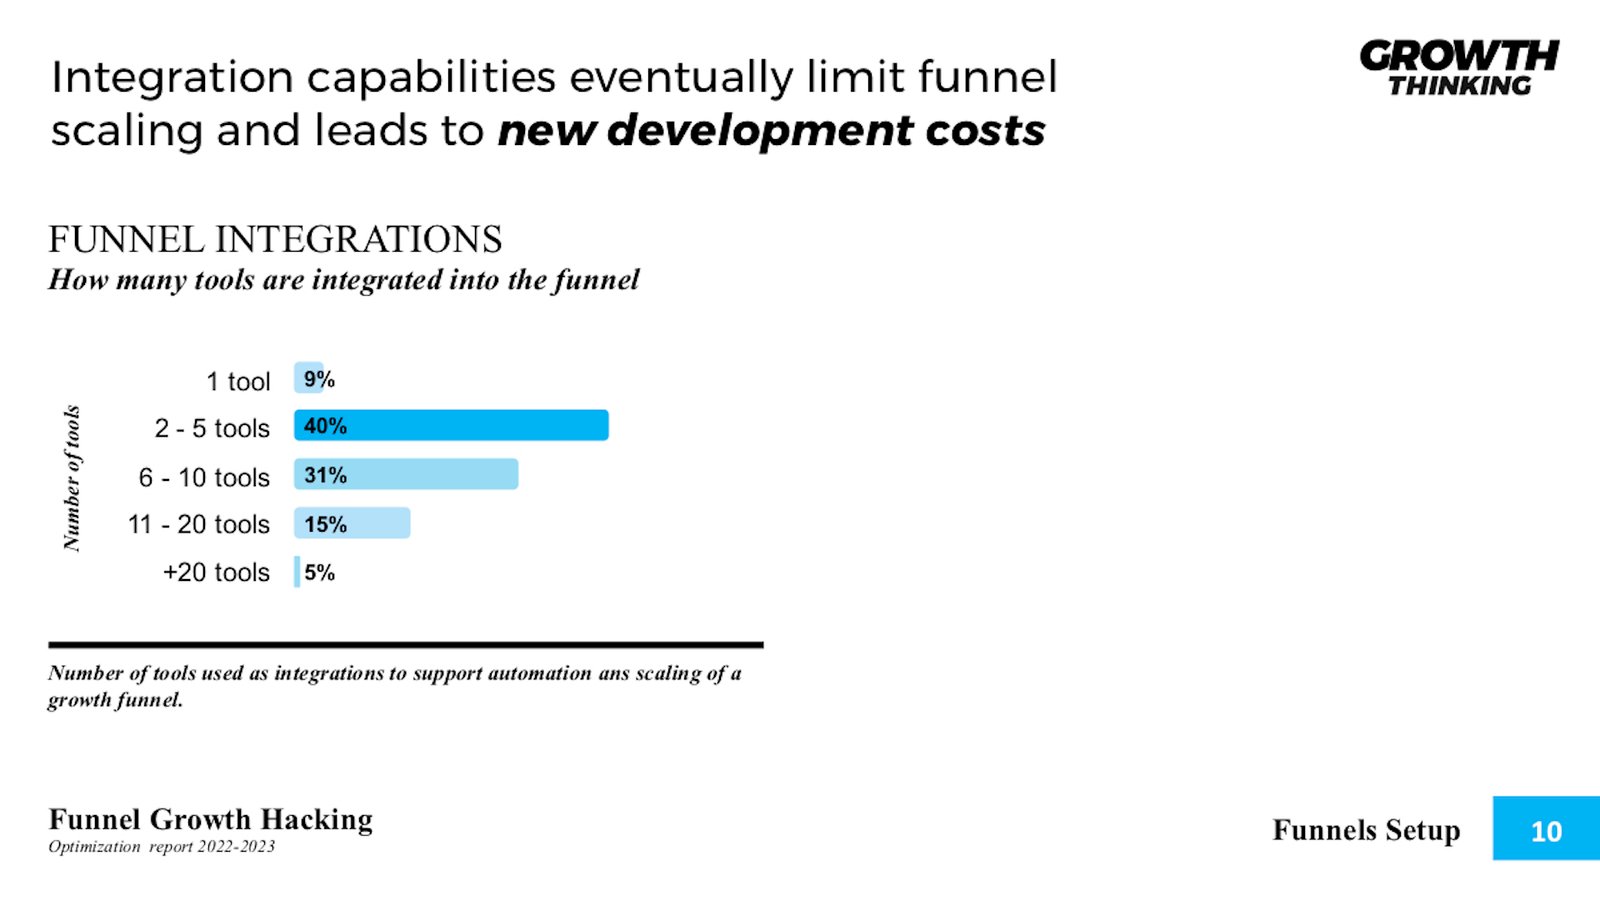
Integration capabilities eventually limit funnel scaling and lead to new development costs
Funnel Integrations
80% of funnels use 10 tools or fewer throughout the whole funnel itself.
90% of no-code users think their company has been able to grow faster due to its no-code usage, according to studies by Zpaier
Background
Native integrations are a vital part of choosing the right off-the-shelf funnel. Most of the commercially available and popular funnels have an overlap of 80% of the integrations. Here are the top integrations to be used in a funnel based on requirements from HubSpot:
Send notifications to your team after important events.
Log important emails.
Send thank you messages to customers.
Follow up with leads.
Aggregate form responses.
Create tasks from important events.
Automate social media posts
Share social posts internally.
Stay on top of your schedule.
Google Sheets → Google Calendar
Create contacts in your CRM.
Create backups.
Send out summary reports.
Take quick notes.
Automate video posts.
Often you will find these tools being already used as part of the tech stack in a growth hacking process.
Context
Integrations are not going to stop growing. Integrations are a competitive advantage not just for funnel providers but the tools themselves being integrated. With the advancement of APIs and a more open approach, more integrations are being developed. Historically, integrations did not yield commercial benefits. That has dramatically changed and integration is now a big business. This means not just more integrations but deeper integrations. Beyond this with no-code and low-code solutions, funnels can be even more customized with integrations. It’s also noteworthy to align tools and integrations with the AAARRR pirate funnel framework.
Takeaway
Integrations are key to enhancing your funnel optimization. The good news, for free or low cost, you can have highly sophisticated optimizations take place using pre-built integrations,
Subscribe for updates
Funnel failures lead to a 21x impact on revenue when new learnings are carried over effectively
Number of Funnels Created
41% of funnels are in their 5th generation and beyond.
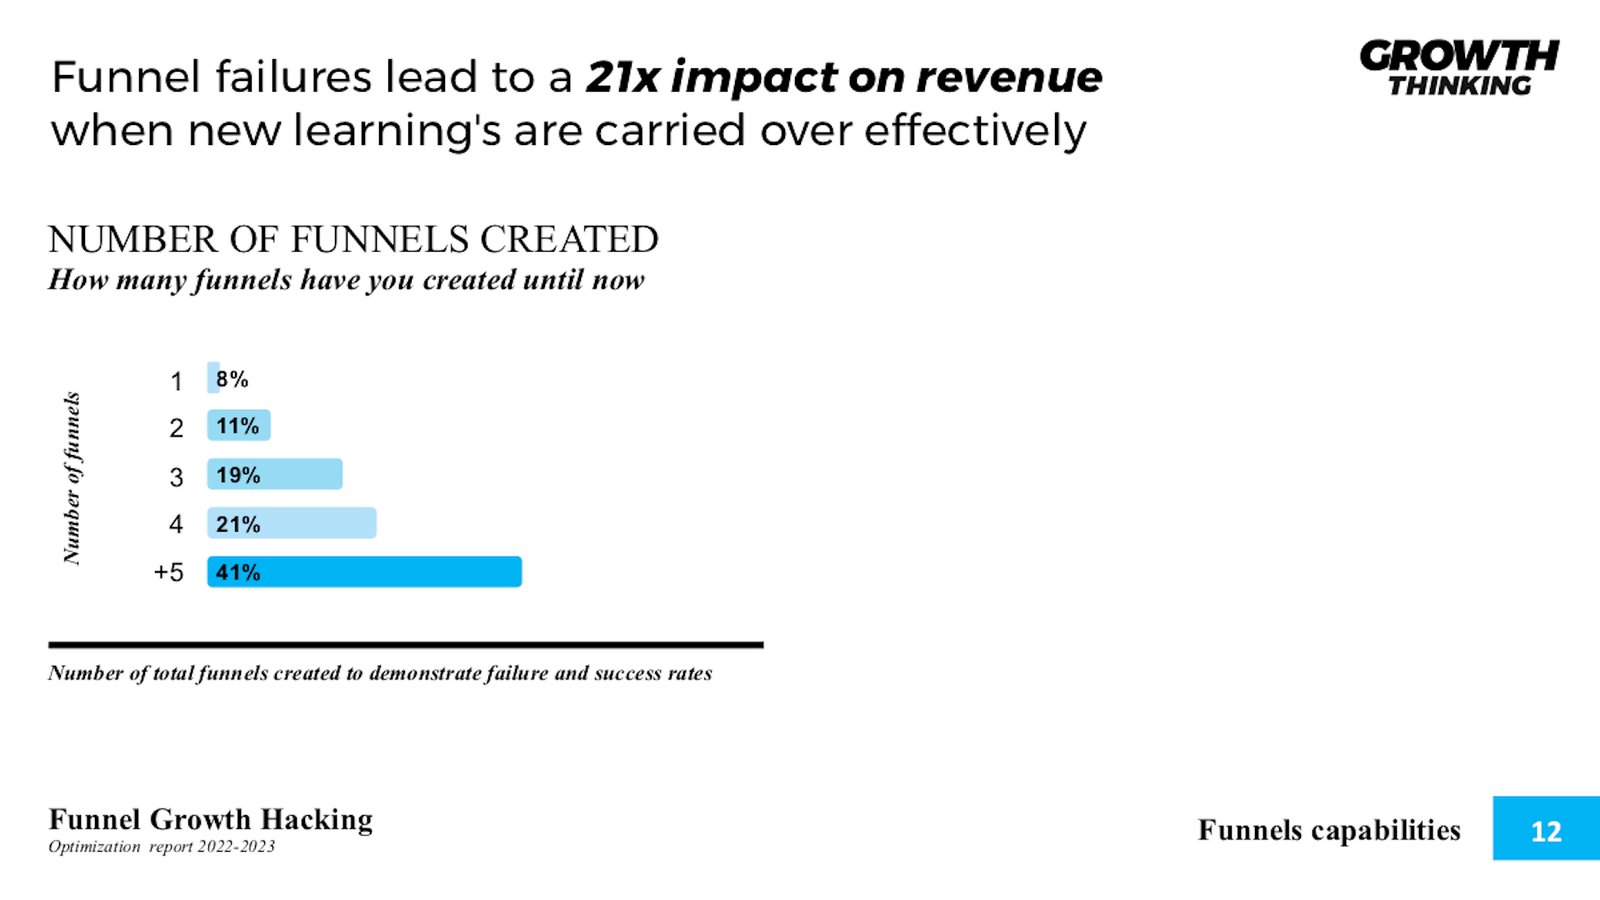
According to HIRSH MARKETING, one funnel is the main target until it performs profitability to justify the next development.
Background
Failure is a natural part of the process of building a funnel. Not only is it about finding optimization points but consumer behavior and consumption patterns change quickly. Being able to align internal optimization and external changes are the two driving factors of success.
The reasons why a funnel can fail:
- Less than 1% of funnels generate $1 million in sales according to ClickFunnels
- Failing to measure – 68% of companies have not attempted to measure the sales funnel
- Not optimizing – only 22% of businesses are satisfied with their conversion rate
- Not adding a sense of urgency can cause an increase in sales by up to 332%
- Not having enough landing pages – 10 to 12 landing pages can boost up leads to 55%
- Having more than one offer on a landing page can decrease the conversion by 266%
- Not having social proof – pages that feature social proof convert 1.1% better
- Too much info – 40% of prospects are willing to share information after converting
- Underestimating email – the average value of an email subscriber is $48.87
- Not upselling – upsells are 68% more affordable than acquiring a new customer
Understanding key failure points are the first step, but also keep in mind in a funnel structure the top failure point is handover. Handover is optimizing between phases in the funnel itself, not just focusing on the phases themselves.
Context
To optimize a funnel, they need to be rigorously tested quickly and for the lowest cost possible to start with. Eventually, the funnel will get more complex but will need to be flexible to accommodate for changes. By the time you have reached your 5th generation the enhancements in learning will be rich enough to have a great idea of how to customize. Although off-the-shelf solutions may continue to be used for generations to come, inevitable integrations, automation and customization will come into play.
Takeaway
Failure is profitable. However, this needs to be managed. The best way to manage this is through data-driven decisions, coupled with the right tools. It’s always best to start the process by knowing you will most likely need to develop 5 generations and more of your funnel before you reach a healthy conversion rate.
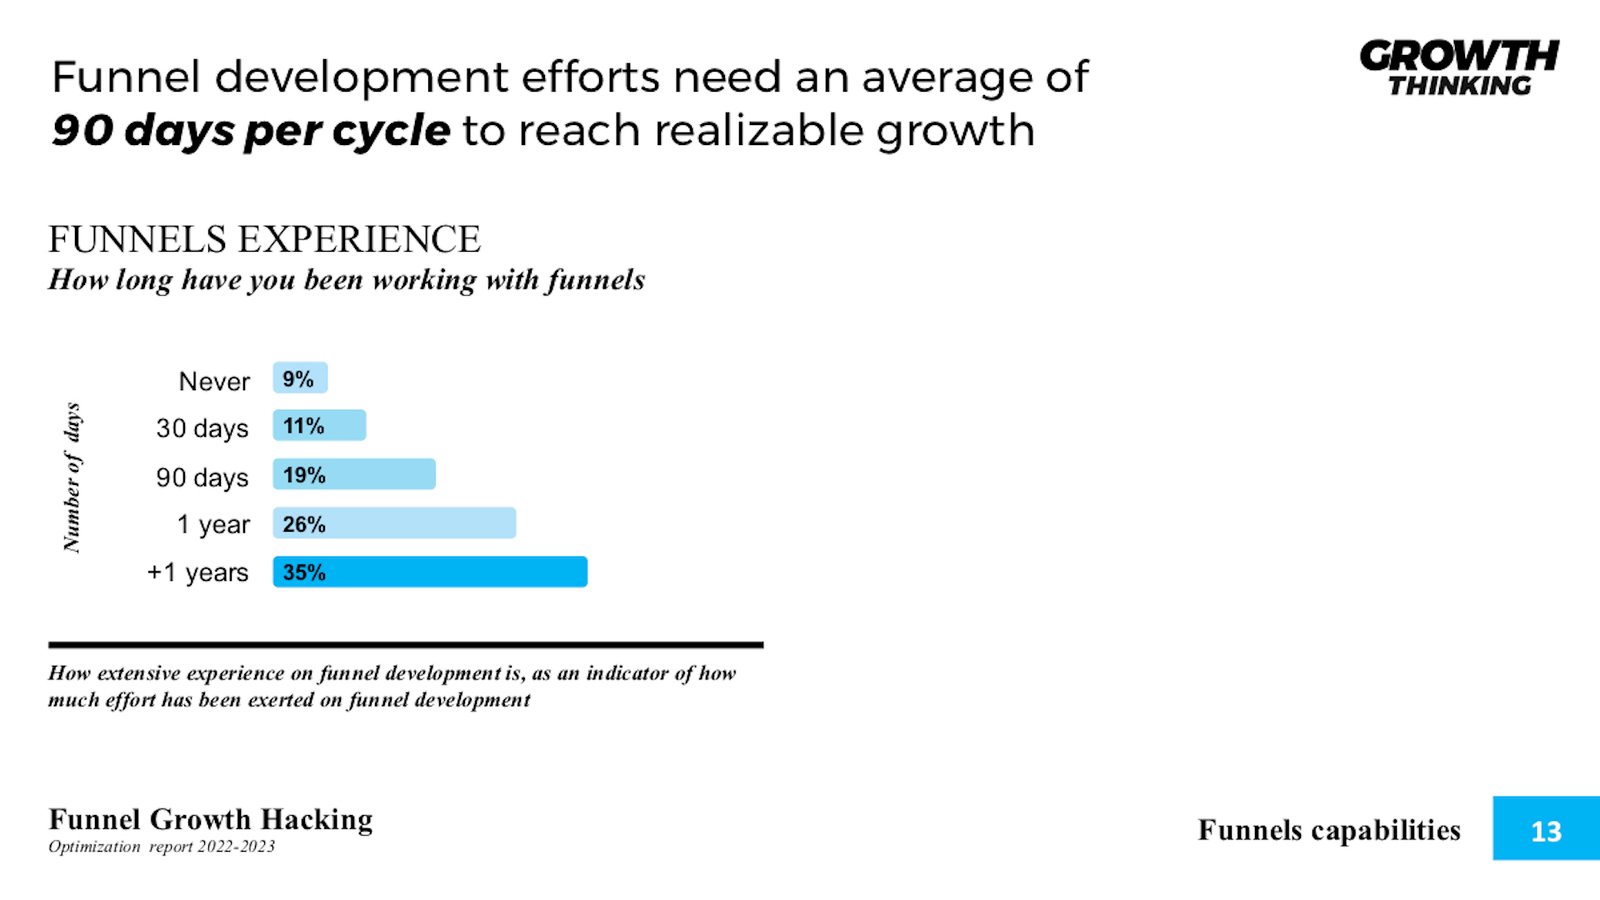
Funnel development efforts need an average of 90 days per cycle to reach realizable growth
Funnels Experience
61% of funnels have 1 year plus experience in development.
Background
Funnels take time to figure out. With no-code and low-code funnel solutions this is shortened quickly, easily, and in a cost-effective manner. Funnels take time and need time to optimize to understand how potential customers respond to your offerings. On average, 238 changes take place over a year in optimizing an average sales funnel with a single offering.
Here are conversion rate optimization tools listed by HubSpot
- HubSpot
- HelloBar
- Sumo
- Picreel
- BuzzSumo
- SimilarWeb
- Land-book
- Really Good Emails
- SubjectLine.com
- Headline Analyzer
- Kissmetrics
- Google Analytics
- HubSpot Website Grader
- Hotjar
- Clicktale
- Clicky
- Crazy Egg
- Heatmap.me
- Intercom
- Qualaroo
- SurveyMonkey
- Five Second Test
- Optimizely
- Effective Experiment
Although each one of these tools serves a different purpose, you’re most likely going to use several of them. There is yet to emerge an all-in-one conversion rate optimization tool. Although that might sound inconvenient, this is in your best interest. Tools that are best of bread should be used as best of bread, not for other functions they are not good at.
Context
The average website conversion rate is 2.35% whereas the best performing websites have conversion rates of 11% or more. This dramatic gap in results is all about optimization led by data-driven decisions. The highest average conversion rate by traffic source is paid search (2.9%) which indicates one very important thing. The more immediately you can satisfy a customer’s needs, the higher the conversion. The best way to do this is advertising, which gives you the tools to accurately target the right customers at the right time.
Econsultancy, a leading e-commerce consultancy, found that for every $1 spent on conversion rate optimization, it costs $92 in customer acquisition. This gap in spending to get traffic and turning that traffic into customers isn’t profitable — many companies are spending too much on traffic and not enough on conversions. Top-converting companies spend at least 5% of their budget on conversion rate optimization. Growth hacking processes often are top-level heavy and hence create growth leaks in the growing systems.
Takeaway
The gap in spending to get traffic and convert them into revenue is massive. Making this work means you have to work fast. With a 90-day turnaround cycle and a large cost gap, the need for conversion rate optimization is significant.
Funnels need more people supporting back-end operations to ensure funnel effectiveness
Funnell Team
52% of team working and supporting funnels are between 6-10 people.

22.7% of teams are launching more than 10 experiments per month according to The State of Growth 2021
Background
A third of companies that have 201-1000 employees are launching more than 10 experiments per month. Companies with 10 employees or fewer are also launching 10 experiments per month on average as well. There is a gap between highly developed teams and highly motivated smaller teams. Keep in mind, that those working on funnels are not alone. There are supporting team members who play a vital role both in development, and operations. Seeing this in its full 360-degree perspective is important. This enables a more productive growth team, shaping growth as a mindset and culture within the organization.
Context
Growth teams require a diverse set of skills. That said, they will all need to understand, manage and contribute to the growth funnel. Whether this is direct or indirect, it will have to happen. Here is a breakdown of skills needed:
LEVEL 1 – skills and capabilities for a T-shaped growth hacker
- Front-End Code
- Service Design
- UX Design
- Behavioral Psychology
- Stakeholder Management
- Augmented / Virtual Reality
- Finance
- Omnichannel Marketing
- Distributed Ledgers
LEVEL 2 – skills and capabilities for a T-shaped growth hacker
- Analytics
- Conversion Rate Optimization
- Experiment Design
- Funnel Marketing
- Automation & APIs
- AI & Machine Learning
- Branding / Storytelling
- Copywriting
LEVEL 3 – skills and capabilities for a T-shaped growth hacker
- Paid Social
- Organic Social
- SEO/SEM
- Tools Marketing
- Marketplaces
- Sales
- Email Marketing
- Content Marketing
- PR / Influencer
- Qualitative Research
- Virality
- Retention
- Mobile Optimization
- Landing Page Creation & Optimization
- Lead Generation
- Revenue Testing
- User On-Boarding
- Lifecycle Marketing
The better your internal processes are at managing this process, the better the outcomes are in utilizing your team and optimizing your funnel. Aligning skills in the T-shaped growth hacker
g model with the pirate AARRR funnel approach is important. A growth hackers goal setting is different from other goal-setting strategies because they focus on the growth aspect exclusively. A chief growth hackers role is to ensure that this exclusive focus becomes cross-functional. This is one of the biggest challenges with growth hacker goals that are too narrow. Therefore, growth hacker strategies need to shift from a singular executive approach to a wider cross-functional strategy.
Takeaway
Organizations will need a diverse set of skills on their team to directly manage their growth funnel and also support members. Support members will enable the funnel across other functions. Cross-function growth hacking is vital in ensuring growth takes place, especially among larger organizations.
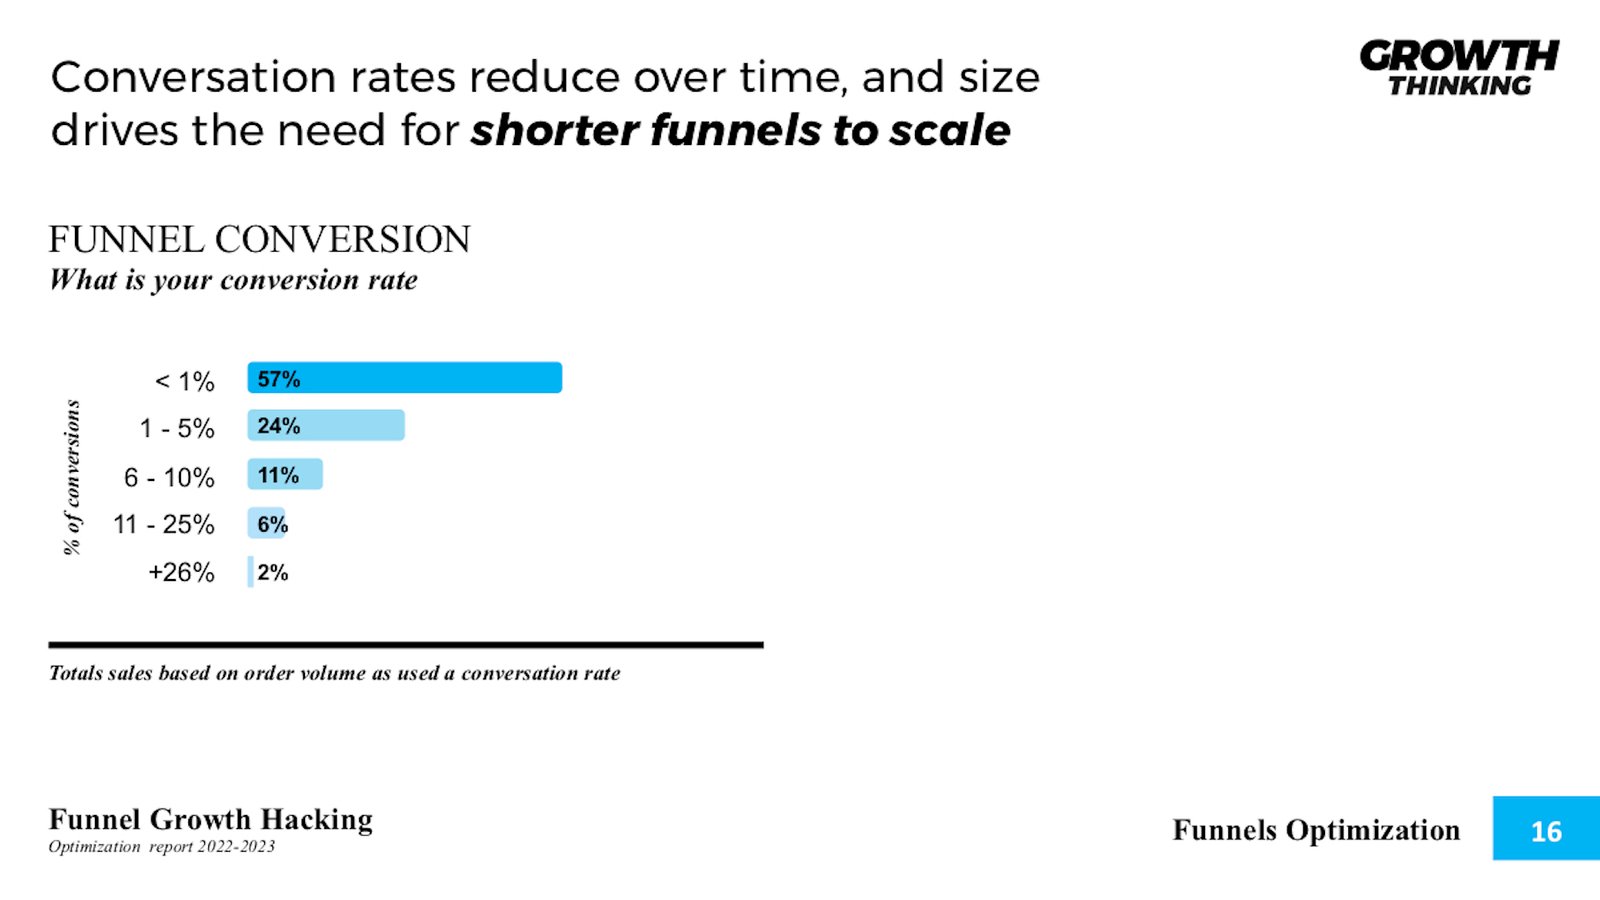
Conversation rates reduce over time, and size drives the need for shorter funnels to scale..
Funnel Conversion
57% of conversations are at a converter rate of 1% or less.
Background
Conversion rates can vary widely, but understanding that a conversion is the transformation of a potential client into actual revenue is important. Although many metrics are involved in the process, what counts is sales revenue.
Context
Outdated funnels drive optimization and result down with time. Frequently updating, upgrading, and optimizing a funnel is vital; 16x more effort is required over the lifetime of a funnel to maintain relatively the same level of conversion results.
Therefore to optimize and increase conversion, +16x efforts need to be made to ensure funnel converts even better over time. We have seen funnel trends indicating that shorter more optimized funnels are outperforming long funnels.
There is a caveat detected that short funnels need to be supported with additional information for more information-driven decision-makers outside the funnel itself. The secret to it is ensuring the link between more information and a short funnel is well-optimized so it doesn’t cause a distraction and low conversions.
Takeaway
More efforts will have to be exerted over time to ensure even higher conversions. This form of optimization has many complexities ranging from changes in consumption patterns to customer needs.
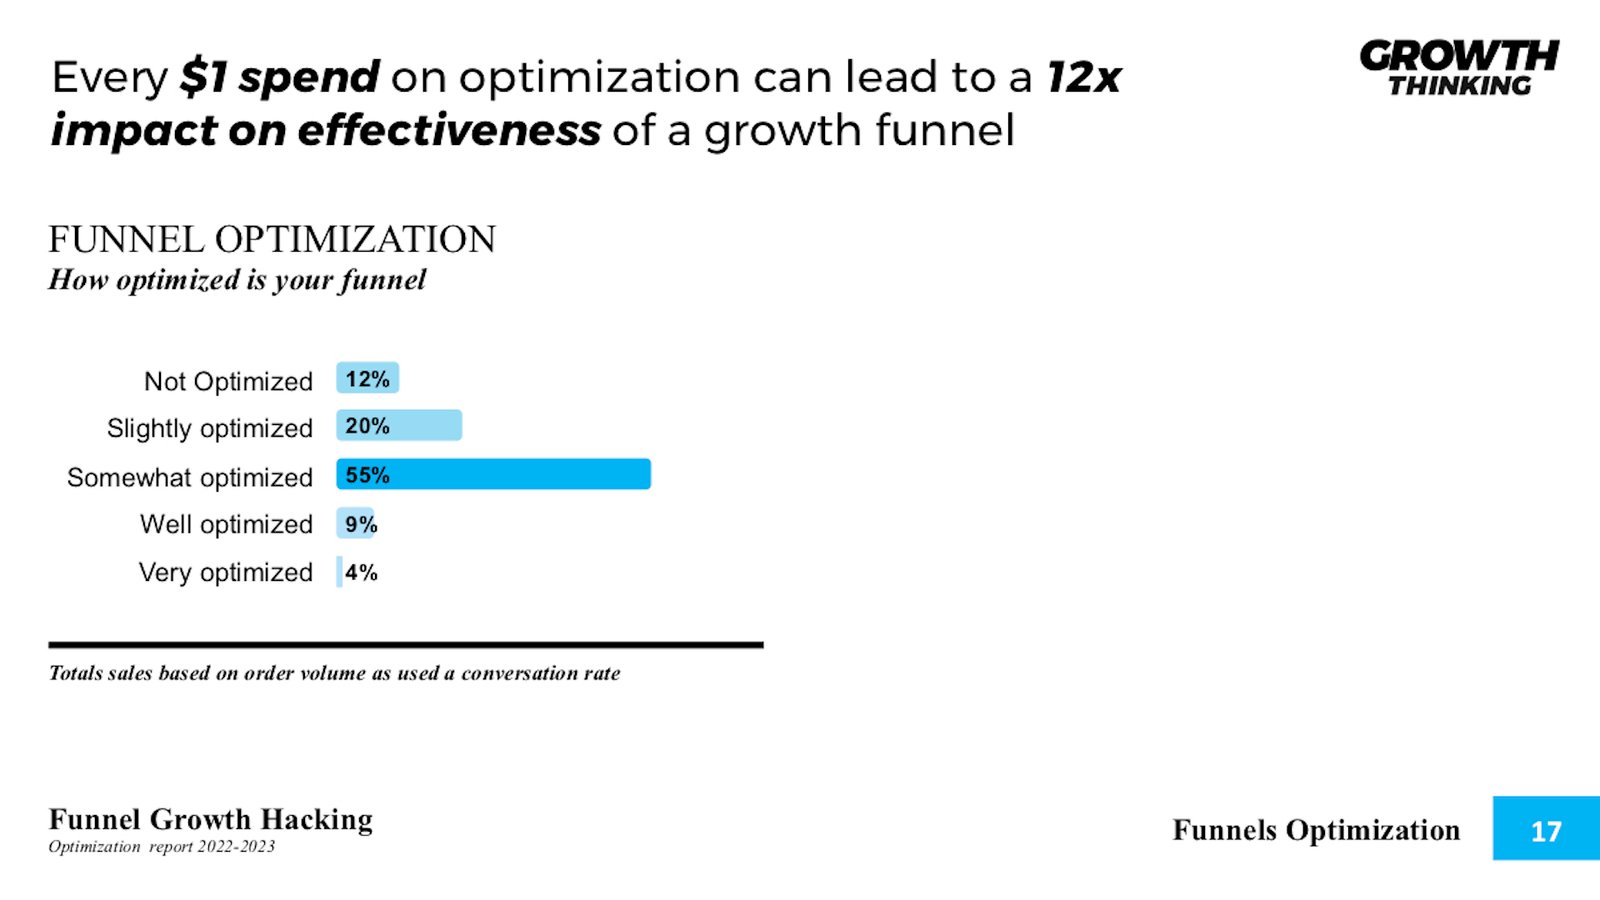
Every $1 spend on optimization can lead to a 12x impact on effectiveness of a growth funnel
Funnel Optimization
55% of growth funnels are somewhat optimized
On average, companies are spending as much as $2,000 a month on conversion rate optimization tools – Forbes
Background
Several forms of effort are required to make a funnel work. A funnel cannot stand alone. It has to be supported by several cross-functional skills (for a T-shaped growth hacker). Those surveyed indicated that their efforts can be much more effective.
Context
Growth funnel experts indicated that their efforts are mostly spent on the design and automation aspects of the funnel. However, they indicated that the more efforts are put into pure optimization, the more comfortable and confident they would be about their funnels. This is where no-code and low-code speed up and lower the cost and time inputs. This gives funnels a better chance of being better optimized.
Takeaway
More efforts from the very start need to be placed on pure optimization capabilities. Data-driven approaches are vital, but this needs to be combined with cross-function inputs across the organization.
Subscribe for updates
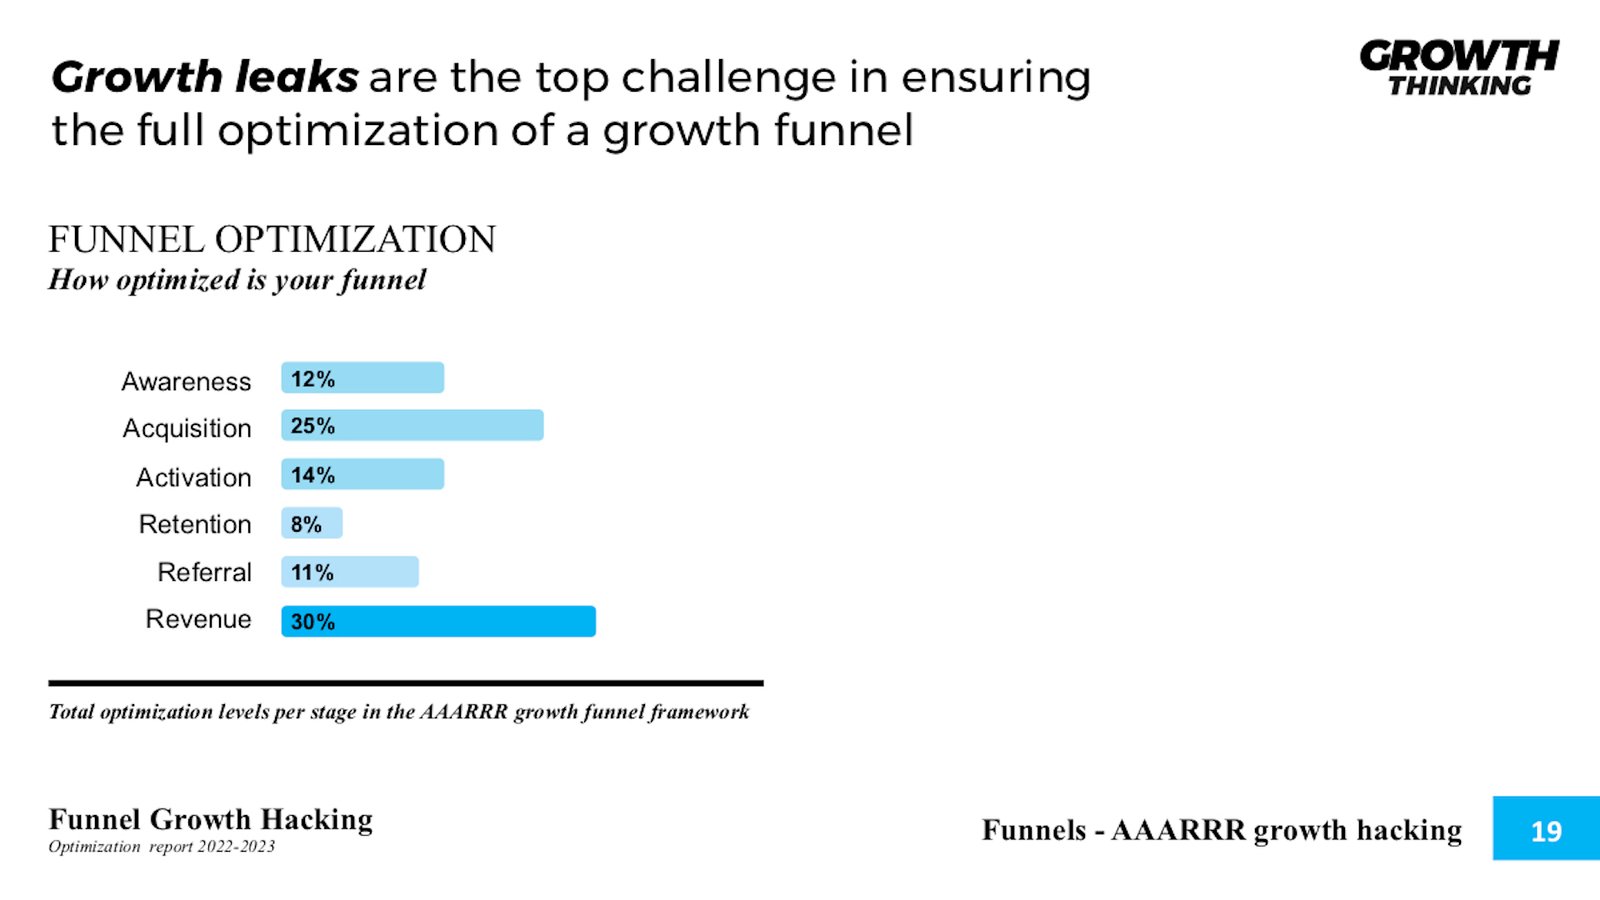
Growth leaks are the top challenge in ensuring the full optimization of a growth funnel
AAARRR Pirate Funnel
30% of optimization is focused on revenue in the last phase of the funnel
Background
Throughout the funnel, all areas play an important role in ensuring full optimization. When taking a look at the overall funnel from the AAARRR pirate funnel framework, we have two major areas standing out revenue at 30% and acquisition at 25%.
Context
No single funnel works in the same manner. This is why seeing it as a framework is important. Where the focus is placed is where the funnel gets stronger. However, focusing on one or a few phases weakens the overall funnel. This is where growth leaks occur. In this case, there is an over-focus on one stage in the early phases, which is the acquisition, and in the latter stages in revenue. Although this might make sense, it creates growth leaks in the intermediate phases.
Takeaway
Do not allow growth leaks to happen by overlooking all components in your growth system. A growth system keeps all parts intact, ensuring the best optimization levels.
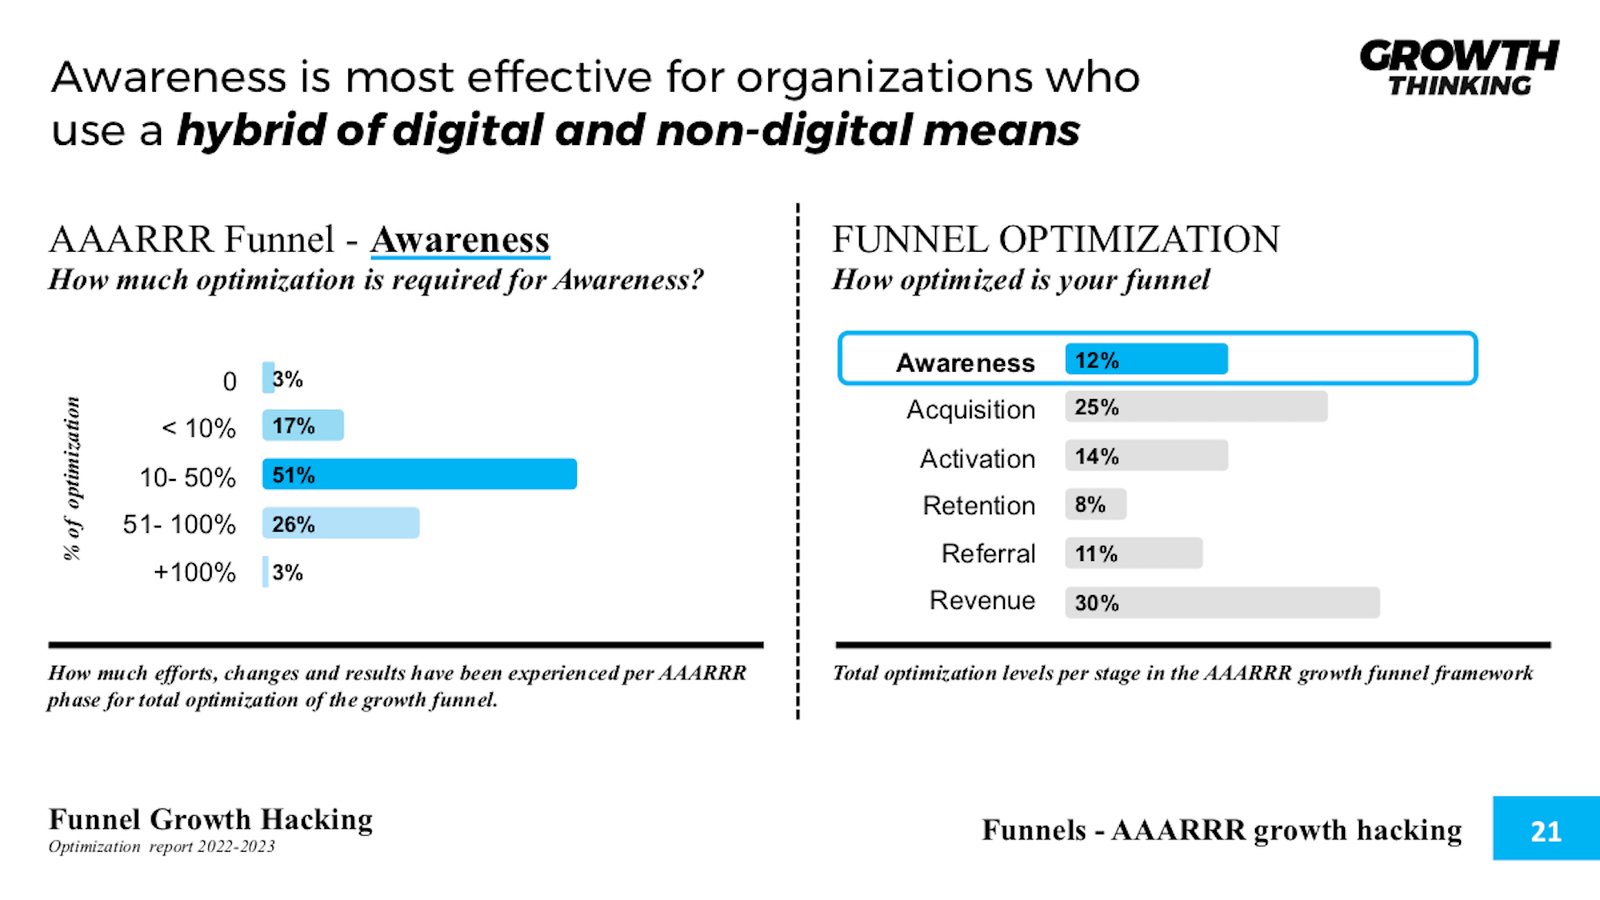
Awareness is most effective for organizations which use a hybrid of digital and non-digital means
AAARRR Pirate Funnel- Awareness
71% of optimization required in awareness yields 50% and less effort
Background
Awareness is at the top of the funnel. This essentially is your entry point. If your awareness doesn’t yield large enough exposure, both in quantity and quality, the remaining of the funnel will be largely ineffective. Acquiring a new customer is 5 times costlier than keeping an existing one, hence, awareness has to be well-done. This means being able to target the right customers, at the right time in the right place. These efforts are multiplied by the fact that you need to be in many places at once over a period of time. Awareness is a costly exercise.
Context
The awareness phase is 13x more costly than any other component of a growth funnel. Therefore, if it’s not done effectively it won’t work well, as it impacts customer acquisition costs, and then impacts customer lifetime value. Hence, cost-effective awareness is vital, like using low-cost public relations, organic community building, email list building, and social media campaigns. Although paid ads are 28x more effective in hitting the right target they also need a larger cash flow upfront to sustain. This can become an uneconomic solution for many companies.
Takeaway
Garbage in, garbage out. If your awareness isn’t effective, the rest of your growth funnel will suffer. Therefore, focusing on long-term quality organic awareness lowers customer acquisition costs and will raise customer lifetime value. This makes the growth hacking process even more essential to companies of all sizes to make this happen.
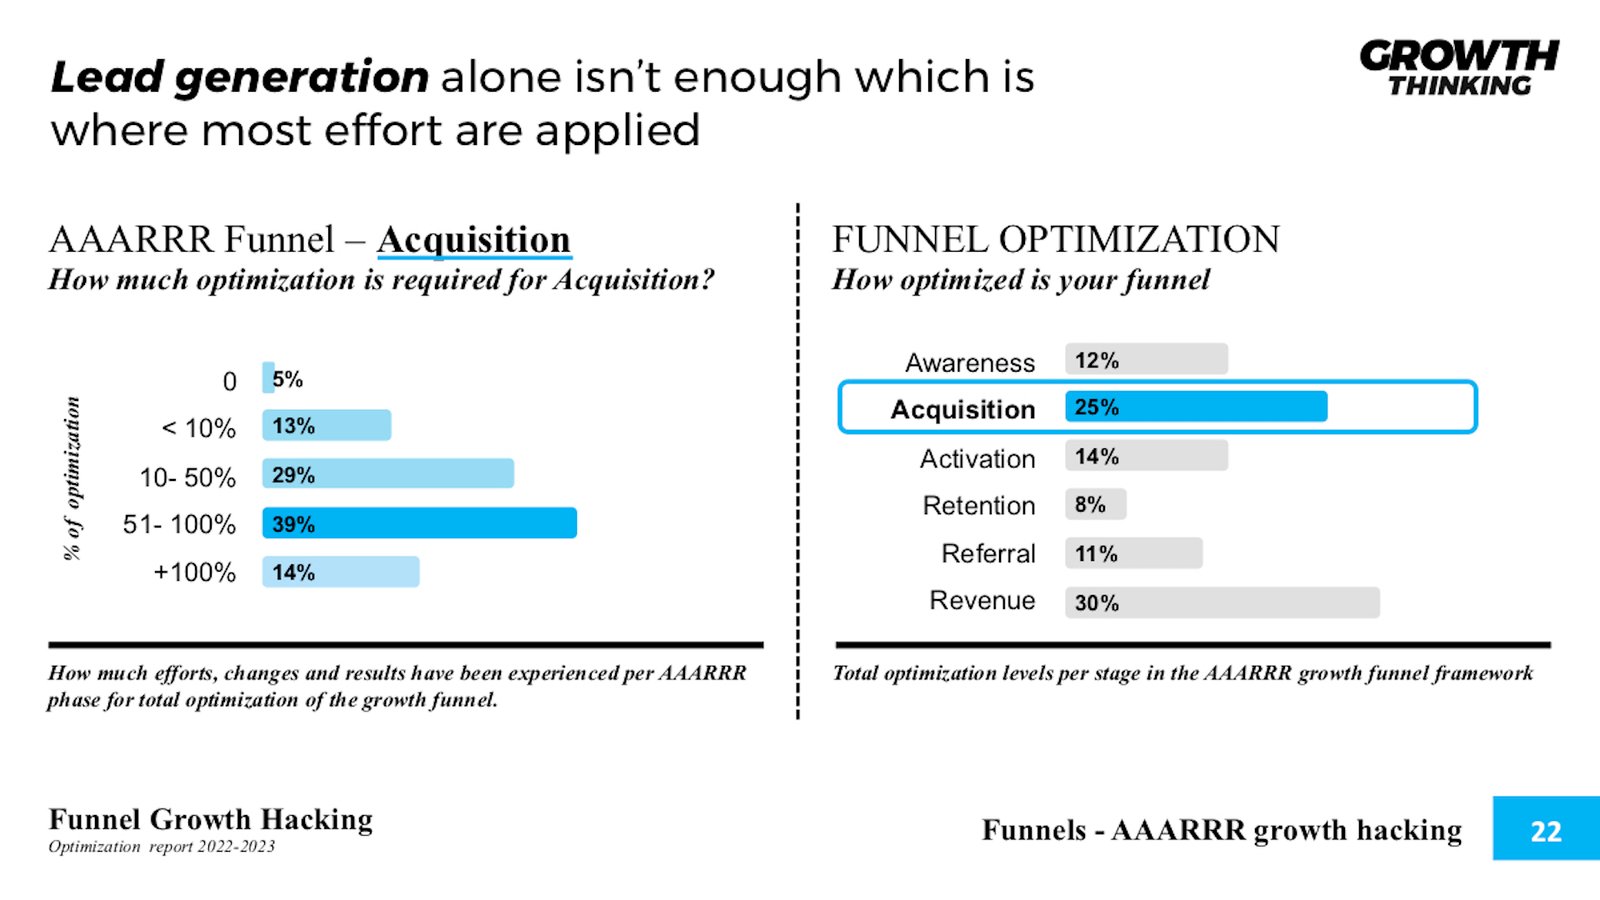
Lead generation alone isn’t enough, which is where most efforts are applied
AAARRR Pirate Funnel - Acquisition
39% of efforts in the acquisition of a growth funnel yield a 51- 100% return.
Background
Put simply, customer acquisition cost (CAC) is the cost of acquiring a new customer. CAC is a metric no organization can afford to ignore. CAC is important as it guides organizations to make such decisions as:
- Which channels should we put more effort into?
- What promotional activities yield the best returns?
- Is it worth spending more on reaching quality leads?
- Who are the customers who yield the highest return?
- How to lower costs?
- Should we change our price?
- How can we segment our customers better?
Such strategic questions help to leverage two important things, lower costs, and increase the yield on spending. Strategies for reducing customer acquisition costs are using levers like conversion rate optimization, shortening your sales cycle, rewarding referrals, and creating added value.
Context
The cost of acquiring a customer is vital to ensuring your unit economics work. From the cost of a customer to the lifetime value, those metrics need to be well-measured and guide strategic optimization decisions. Here is a look at the average CAC in a variety of industries:
- Travel: $7
- Retail: $10
- Consumer Goods: $22
- Manufacturing: $83
- Transportation: $98
- Marketing Agency: $141
- Financial: $175
- Technology (Hardware): $182
- Real Estate: $213
- Banking/Insurance: $303
- Telecom: $315
- Technology (Software): $395
By nature, demand increases over time in healthy industries, indicating that the cost of acquiring new customers will always go up. That said, so does the customer lifetime value
Takeaway
Getting customer acquisition costs down and customer lifetime value up is the name of the game. Keeping track of costs, and ensuring strategies that lower costs over time are effective is vital. At the same time, understanding the increasing value of customers over the lifetime of a customer needs to leverage value-creation that makes sense and is profitable.
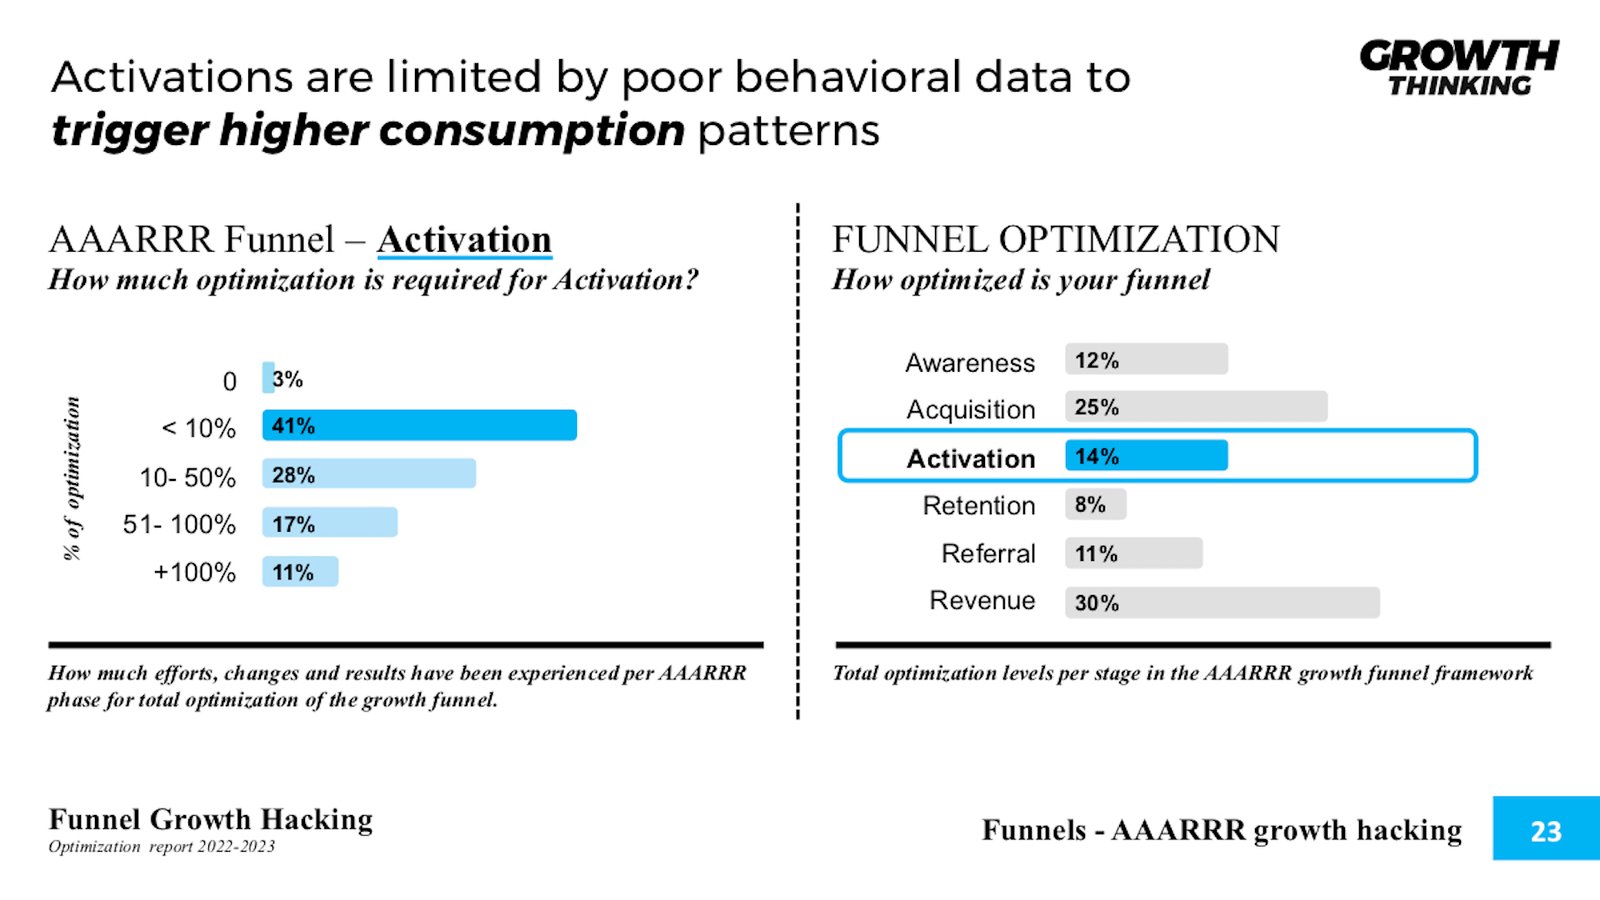
Activations are limited by poor behavioral data to trigger higher consumption patterns
AAARRR Pirate Funnel - Activation
41% of optimization is 10% less effort for activations
Companies with a greater focus on customer satisfaction have 1.5x higher employee satisfaction, 1.6x higher brand awareness, and 1.9x higher order value. – SmartKarrot
Background
The goal of activations is how fast can customers find value in your offering. This is where onboarding plays a crucial role in customer value creation. This is essentially an AHA moment where value is identified, and created for the customer. When this value-creation moment happens, this is where customer lifetime value goes up by x6 due to the fact they see themselves using that product or service for a long time. Some of the measures the activation phase measures are:
- Time to Value
- Visitors to registration ratio
- Conversion rate
- How many customers used a crucial product feature?
- How many customers experienced the AHA moment?
- Drop-off rate
- Dwell time + viewed pages
Context
Onboarding has a high impact point as studied by Growth Labz on aggregate revenue. The goal is to apply the least amount of friction to get the customer the initial results they want. This is not about the best, or most optimized result, but an entry point good enough to win a customer’s confidence. This is where further onboarding programs help leverage initial results and build on them; 84% of onboarding programs don’t go far enough to support the customer journey.
Takeaway
Build an effective onboarding process that gets customer value fast. Once you have established this value baseline, build on it and do not leave customers hanging throughout the customer service experience.
Retention can create 25x aggregate revenue when optimized toward incentives and viral loops
AAARRR Pirate Funnel- Retention
43% of optimization efforts have a 100%+ impact on growth in the funnel
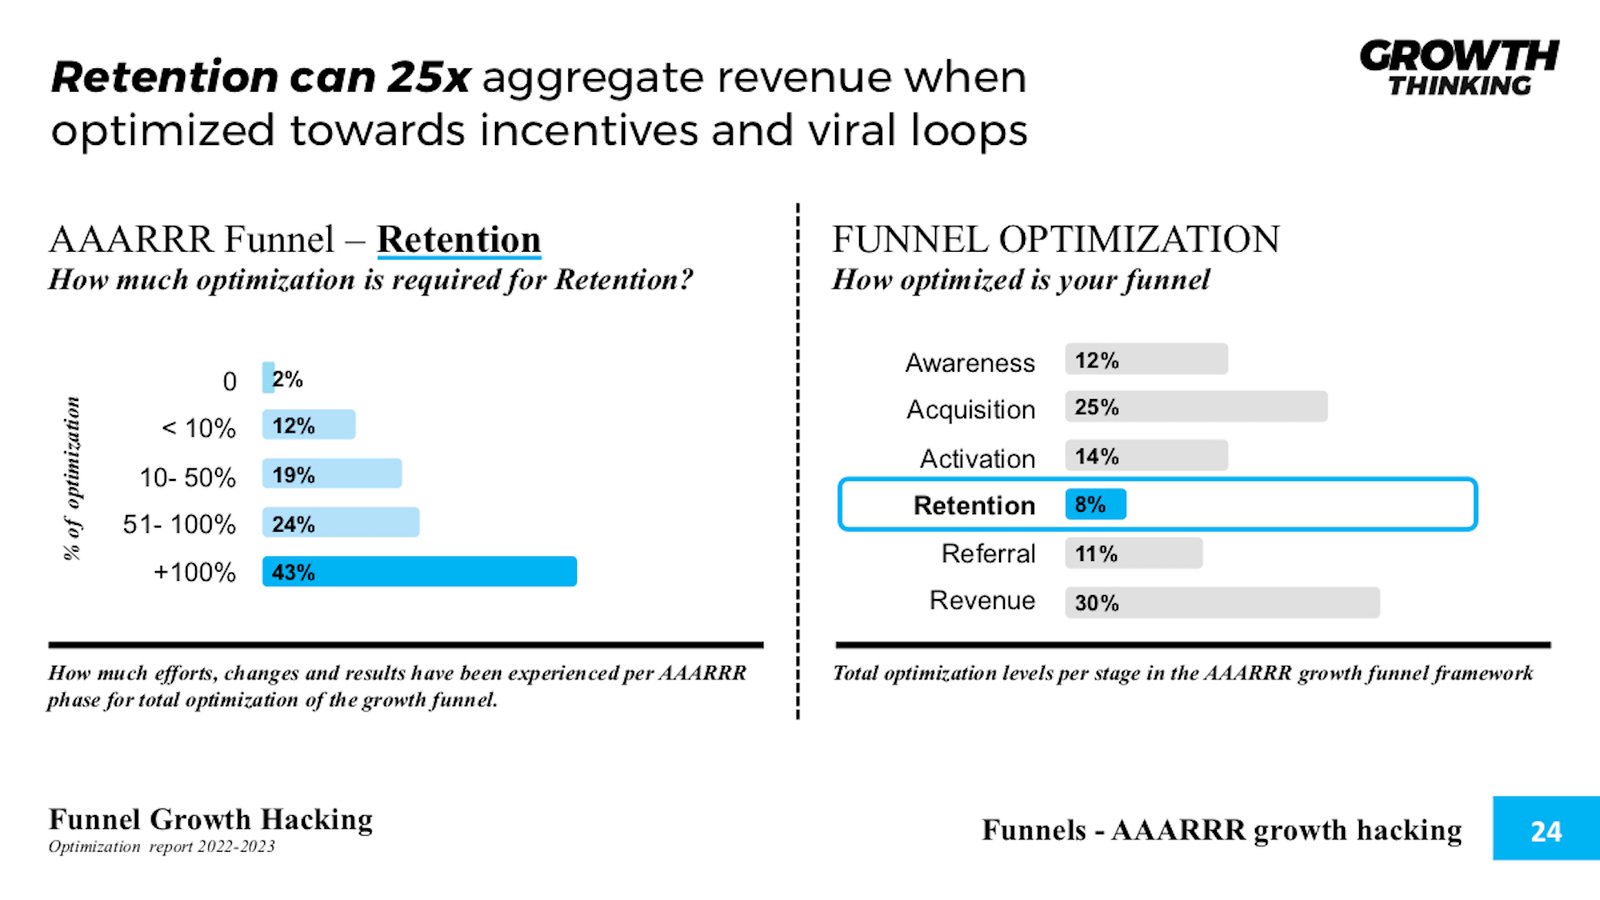
Background
Why should customers come back to you? This is the central question to retention; if they have a great starting experience but see no value to continue you have no retention. What you want to avoid is a situation where value creation stops quickly. Some of the measures to be used to understand and better optimize retention are:
- Retention rate vs. churn rate
- Open rate of emails
- Click through rate of emails
- Customer churn
- Month to recover CAC
- Average customer retention length (time people stay active customers)
- Net Promoter Score
- Infrequent logins
Context
Retention is about addressing some key questions that lead to strategic decisions on retaining customers in the long term:
- How long are customers active?
- How long are customers using my service?
- What does customer retention mean for my service?
- What is most valuable to my customers?
Retention boils down to problem-solving. If the type of problem you’re solving for your customers is ongoing then you’re more likely to have higher retention. However, if it’s a one-off that happens frequently then the question is what are the side-effects or by-products of your solution that will continue? Understanding this helps identify how to retain customers.
Takeaway
If you cannot continuously provide value, customers will eventually churn. A high churn rate means more cost and more cost means less profitability. Retention is vital to growth, and an area where growth leaks are hard to recover if it starts to become unoptimized.
Subscribe for updates
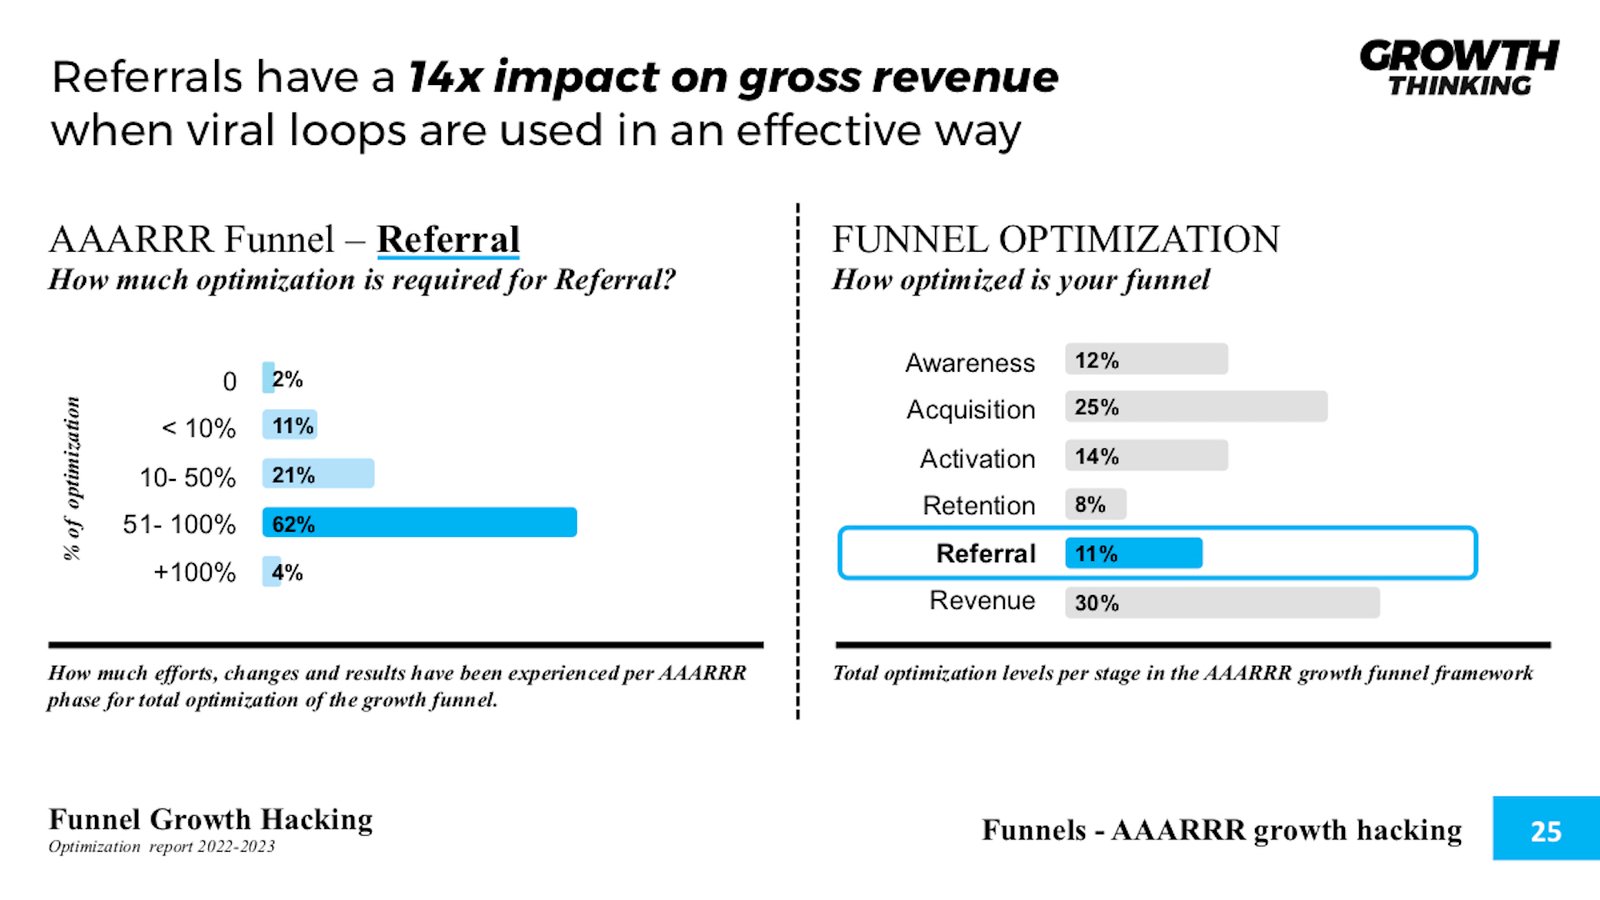
Referrals have a 14x impact on gross revenue when viral loops are used in an effective way
AAARRR Pirate Funnel - Referral
62% of referral optimization is at a 51- 100% level of efforts made
Background
Why should customers recommend your service? If enough value has been created to motivate customers to tell others, referral efforts have worked.
When the value is created to a point where a customer’s problems are well-solved, they want to share the joy with people they trust. This is where growth hacking viral loops are most effective. A viral loop helps achieve these three things – customers discover and use your service, they tell friends about the service, and friends become customers as well.
The Net Promoter Score (NPS), which measures customer loyalty and the likelihood of churn, helps understand how to manage referrals.
The NPS starts by asking your customers: “On a scale of 0 to 10, how likely are you to recommend us to a friend?” Then, group the respondents into three categories.
- Promoters 9-10
- Passives 7-8
- Detractors 0-6
Calculate the net promoter score like this:
NPS = % Promoters – % Detractors.
Context
Bring this into a full circle with some of the critical questions to address being:
- What incentives would customers need to invite friends?
- What do customers like most about my service?
- At which point of their journey would customers most probably invite friends?
Identifying who those customers are, incentivizing them, and simplifying their referral experience are key to boosting referrals. Some measures to be used to manage this are:
- Percentage of customers who refer friends
- Referred customers
- Percentage of total purchases by referred customers
- Lifetime value of referred customers
- Positive reviews
- Social media shares
- Sent invitations & successful invitations
- Viral coefficient & viral cycle time
- Net Promoter Score
To get referrals moving, approach the best customers and reward them for inviting their friends. However, to really accelerate growth, viral loops will need to be optimized.
Takeaway
Referrals are about creating enough value to motivate a customer to bring you another customer. The goal is to lower customer acquisition costs by spending once on one customer and having that customer recruit other customers for you.
End of funnel revenue has a 25x potential impact when using cross-selling optimization
AAARRR Pirate Funnel - Revenue
35% of optimization efforts are focused to yield 51- 100% when it comes to revenue

Upselling increases the revenue by 10 to 30% on average and 70-95% of revenue comes from upsells and renewals on average – SUMO
Background
Why should customers pay for your service? – Revenue is the last Pirate Metric in the AAARRR conversion funnel. One of the most vital measures in the revenue phase is the customer lifetime value. The measure indicates the total revenue generated by a customer over their lifetime. Calculate the customer lifetime value like this:
Customer lifetime value = Average revenue per customer * (1/churn rate)
Understanding this enables very powerful strategic revenue decisions. Everything from what to segment and behavioral patterns.
Context
Finding the optimal customer segments is the main goal. Although you will address several segments, not all will perform very well. Identifying those segments is the primary goal of using data to make revenue decisions. At the core of this is behavioral data that trigger decisions. Decisions like when, where, and how to place a purchase, and to continue to use the service. There are three primary measures to trigger decisions:
- How many customers become paying customers?
- What is the average order value per customer?
- How many repeated customers do I have and how often do they order?
This is an ideal high-level behavioral pattern to use to segment customers into the most optimal groups to target.
Takeaway
Focus on quality revenue, which is knowing who are your best customers and who not also pay for your services but continue to retain your services.
Subscribe for updates
Conclusion - growth funnels need a lot of work to be optimized
A growth funnel needs optimization at all times and at all levels. The best performing of them are shorter funnels that have been refined over time. The learning curve in understanding why and how to shorten your funnel is the most important part of the process.
Data-driven decisions will be the most important part of the growth hacking process answering questions like, what part of the funnel is working and what is not, what can be done about it, and why is that?
Knowing your unit economics, like custom acquisition cost and customer lifetime value, is worth their weight in gold. A strong grip on those numbers, what they mean, what drives them, and how to use them for your next growth hacking strategy is vital.
Know your funnel, know your numbers, and then know how to shrink it so it’s fully optimized. And remember, it’s an ongoing process.
Growth Hacking Service Report

Nader Sabry
Learn more about Nader Sabry
Methodology
This analysis aims to understand the current state of growth funnels and how growth hacks them. Specifically, to gather benchmarks effectiveness, design, setup, capabilities, and optimization and into the famous AAARRR pirate funnel framework and how they perform.
We also deeply analyzed a subset of top-performing companies with well-established growth teams who have deep experience with growth funnels. .
Funnel growth managers
Funnel growth managers are growth experts who design, manage and optimize funnels either for their own organizations, or their clients or are in the field of training others on how to do this. The following criteria were used:
- Have a growth hacking team
- Have an established growth hacking process
- Have designed, built, and managed a min of 3 funnels
- Have designed, built, and managed a for the past 24 months
Have designed, built, and managed who spend over $1,000 a month on funnels
Data acquisition
Data is obtained through primary sources via a direct survey.
Only complete validated and verified surveys are accepted, with a confidence level of 95%+ and a margin of error of 5%. Data collected is verified and validated as confirmation with participation before publishing. Secondary data is collected via desk research to validate and give context to primary data.
In addition, interviews with industry experts provide independent data and context to existing data collected as background and expert opinions.
Profile
The primary survey has 2,1503,167 participants across ten different industries and six different geographic regional locations. The buyers are senior executives who are the primary decision-maker for buying the growth services themselves.
Future updates have been designed in the data collection methods to provide provisions for expanding on the existing data and further collection for systematic analysis.
ApproacH
We started by identifying companies, agencies, and experts who have experience in designing, building, and managing growth funnels. We then qualify them based on design, built, and managed a min of 3 funnels in the past 24 months and spend over $1,000 a month on funnels
We aim for funnels that have generated $500,000+ a year and have a min return of investment of 50%+. After qualifying and recruiting participants, they where survived based on their own experiences and results\
The target is to capture the state of performance of growth funnels across a wide range of organizations and industries
Constraints
Often, we come across a lack of willingness to want to discuss failures and challenges related overall to their growth. Therefore completion rates were a challenge but only completed surveys have been incorporated into the results of this study. Internal data collection and analysis were limited and did not serve the participants in giving further insights in many cases.
Sources and other studies
The following are studies and sources with a well-established position and credibility in the growth hacking industry. Most of these studies cover internal growth challenges and how to overcome them in macro-data or industry trends based on pure digital means not looking wide enough across the whole growth spectrum.
The most fundamental aspect here is that they don’t cover Growth Service Buying behavior. Although we can gain deeper technical insights, these studies do not cover buying behaviors. Buying behaviors are critical building blocks that shape almost everything discussed in these studies. The lowest common denominator is the adoption of growth services, and that only happens with growth service buyers purchasing and utilizing growth services.
- DEMAND GEN REPORT
- What’s the Best Sales Funnel Software to use in 2022?
- Predictions 2021: Software Developers Face Mounting Pressure
- Software Testing Help
- The 15 Best Zapier Integrations to Optimize Your Business
- Zapier data report: The rise of no-code
- 60+ Sales Funnel Statistics to Know in 2022 [Shocking Stats]
- How many funnels do you need?
- 37 Conversion Rate Optimization Statistics For 2022: Usage, Facts, & Trends
- 24 Conversion Rate Optimization Tools for Research, Feedback, Analytics & More
- The State of Growth 2021
- All About Customer Acquisition Cost (CAC)
- AARRR Framework. The Definitive Guide to Pirate Metrics
- What Is Marketing Automation?
- The Short Life of Online Sales Leads
- State of Sales Development 2021
- Conversion Rate Optimization–Which Tools Are Best?
- Website and SEO for Lead Generation
- The 7 Most Useful Sales Funnel Metrics
- Customer Retention Marketing vs. Customer Acquisition Marketing
- 75 Must-Know Customer Experience Statistics to Move Your Business Forward in 2022
- How to Use SAP Product Configuration to Increase Upsells and Renewals
- The Value of Referral Marketing: Need-to-Know Statistics and Trends
- Ecommerce Upselling: A Step-By-Step Guide To Increasing Sales
Participation profile
Survey Participant breakdown
Profile of data about the survey itself
| Total participants | 3,167 |
| Total circulation | 4,200 |
| Margin of error | 5% |
| Confidence Level | 95% |
| Avg time to complete | 19 min |
| Sources | 25+ |
| Experts | 18+ |
Industry
Industry of participants
| Automotive | 1% |
| Entertainment | 2% |
| Financial services | 3% |
| Food & Beverage | 5% |
| Health | 22% |
| Manufacturing | 9% |
| Media | 17% |
| Professional services | 11% |
| Retail | 1% |
| Technology | 29% |
Survey Participant
Geography geographic location
| North America | 45% |
| Europe | 22% |
| Middle East | 8% |
| Asia | 14% |
| South America | 2% |
| Other | 9% |
Survey Participant Revenue size
Annual gross revenue
| < $500k | 8% |
| $501k – $1m | 31% |
| $1m – $5m | 49% |
| $5m – $50m | 8% |
| $50m + | 4% |
Survey Participant Employee size
Annual gross revenue
| < 10 | 9% |
| 11 to 50 | 42% |
| 51 to 100 | 21% |
| 101 to 500 | 22% |
| 500+ | 6% |
Growth Rates
Average annual growth rate of participants
| 0 | 1% |
| < 10% | 5% |
| 10- 50% | 67% |
| 51- 100% | 24% |
| +100% | 3% |